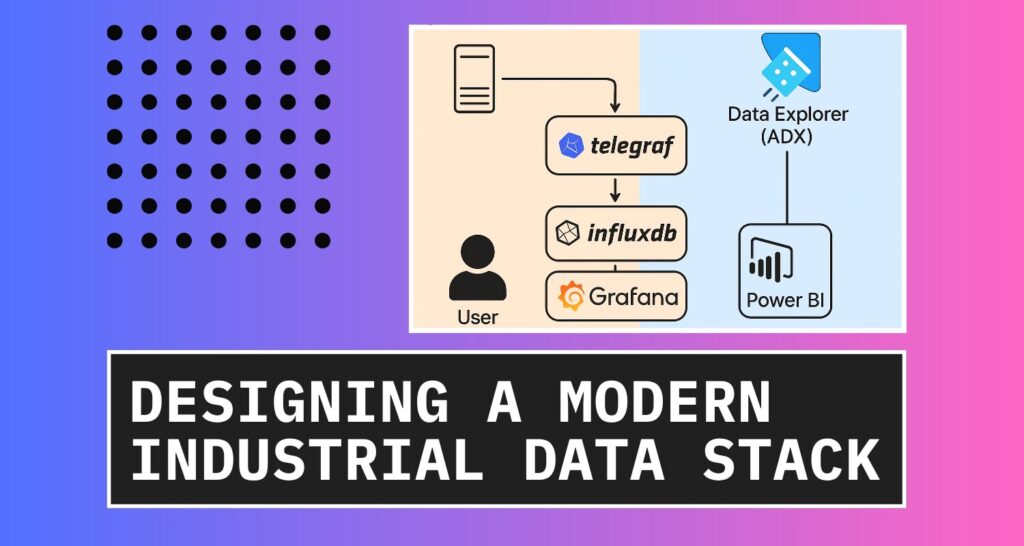
Designing a modern industrial data stack – Part 1
With the increased need to extract and analyse data over the last couple of years and the convergence of OT and IT systems, new possibilities are available to improve the traditional industrial data stack. This has the potential not just to make data available securely, but also reduce complexity, latency, and cost.
In this post we will look at a case study for a new historian implementation at small scale demo facility and compare the traditional data stack to a modern data stack built upon open source.
The traditional data stack
In industrial sectors, lots of data is being used to monitor and control various manufacturing and refining processes. Traditionally, this data is available to SCADA operators and gets stored in a process historian. To optimise processes, this data needs to be extracted and analysed by data analysts and data scientists. We use a process historian to collect data and archive this data, typically in a propriety format.
Process historians are well established, but requires specialised skills, several servers and needs to be licenced. Historians are licenced normally an a per tag basis and involves some sort of annual maintenance fee.
Some historians do not offer a friendly user interface, with some being quite dated in terms of the user interface. Each historian also uses their own terminology and can become complex in terms of configuration. The size of updates can be several gigabytes that can be challenging for sites with low bandwidth.
Architecturally the setup can be quite complex as well requiring several ports to be opened in the firewall to allow communication with the various components through OT network layers. I previously created a blog post on building an OPC UA bridge to facilitate communication. All these servers also need to be patched regularly for security patched and monitored.
Extracting data from the historian can be done with several methods. Standard methods are available with Excel and an abstracted SQL layer, but these are not scalable solutions for substantial amounts of data. They do provide an SDK but that requires custom development and maintenance as new versions are released.
Many historian vendors now offer cloud solutions, at an additional cost, but the data is still in a proprietary format in the same system. The problem of extracting the data remains an issue.
Design of a modern data stack
Process historians are optimised store and retrieve large amounts of time-series data, thus essentially a time-series database. Many time-series databases exist, while InfluxDB is amongst the popular ones. The new InfluxDB 3 was rebuild using Rust and the FDAP stack – which means it is blazingly fast.
InfluxData has another application called Telegraf. Telegraf is a data collector agent that has several hundred input plugins, collecting data from system metrics to logs to sensor data via OPC UA, MQTT and Modbus. It has several output plugins, meaning it can store data in several systems, from local files to cloud databases.
InfluxDB 3 offers two distinct versions tailored for different use cases. The Core edition is an open-source, lightweight solution optimized for edge computing, ensuring efficient data processing in distributed environments. Meanwhile, the Enterprise version builds upon this foundation with advanced features such as historical query support, scalability, and high availability, making it ideal for larger-scale deployments that require robust performance and reliability.
For a modern data stack, we would utilise cloud resources to serve more intense workloads like machine learning and integrating generative AI capabilities. In this design, I will use Microsoft Azure as the cloud provider and utilise Azure Data Explorer (ADX) as our central big data analytics platform. While InfluxData do offer cloud-based solutions as well, I chose ADX to accommodate data from other SQL based sources that is more transactional in nature.
The modern design consists of a data collector, Telegraf, that stores data locally in an InfluxDB 3 Core database. This database is used for short-term, low latency trending, reporting, and analytics together with Grafana, all running on-prem. For longer-term data, ADX is used to enable AI workloads as well as PowerBI reporting. This separates the intensive workloads to use ADX and allow on-prem operational workloads to remain performant.
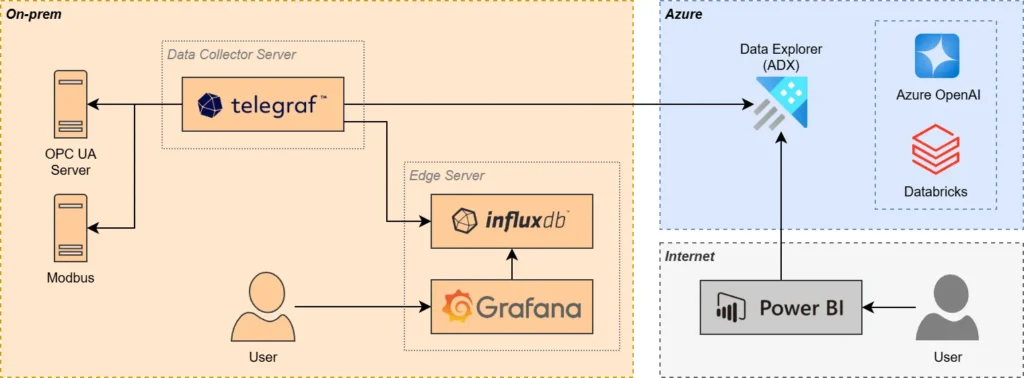
We are using InfluxDB as our edge data store as well as for a on-premises redundancy, should there be connectivity issues to the internet. It is worth to note that the same raw data is also flowing to ADX and the latency can be a few seconds to a few minutes.
Implementation of the new stack
The existing traditional data stack was implemented and working in terms of data collection, but as outlined above, is complex and requires specialised skills and training. I spent several days troubleshooting issues where often the solution was to change some obscure config variable or add user permission, which were not well documented or at all. Third party software is used to extract data from the historian and make it available in the cloud.
The first step for the new stack is creating the data collector server that will run Telegraf, and the edge server that will host InfluxDB and Grafana. These are Windows based servers, but Linux servers would have been better.
Data collection
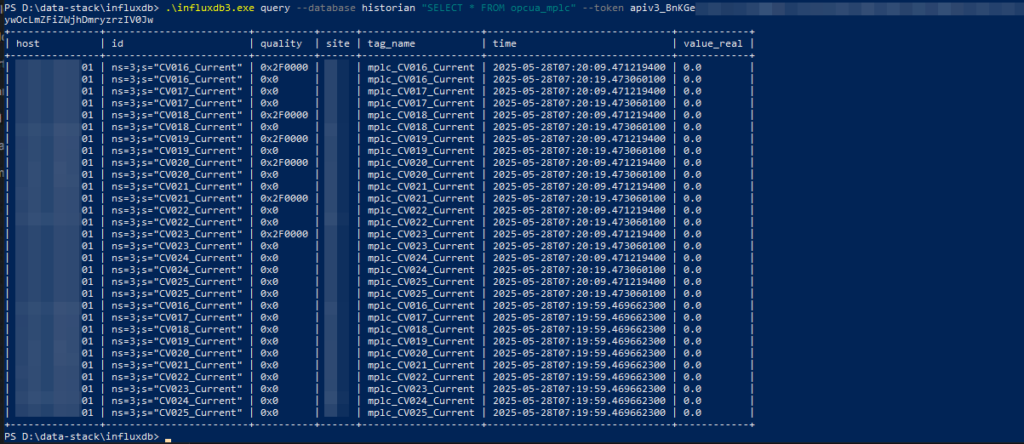
For data collection, we are looking at two OPC UA servers, with just over 700 tags. We use the OPC UA plugin with Telegraf and do some manual configuration to setup the OPC UA tags. I split the config files, one for the agent itself, and the others for each input and output plugins. Importantly, I am using a custom processor to ensure correct schema and data types for the tag values.
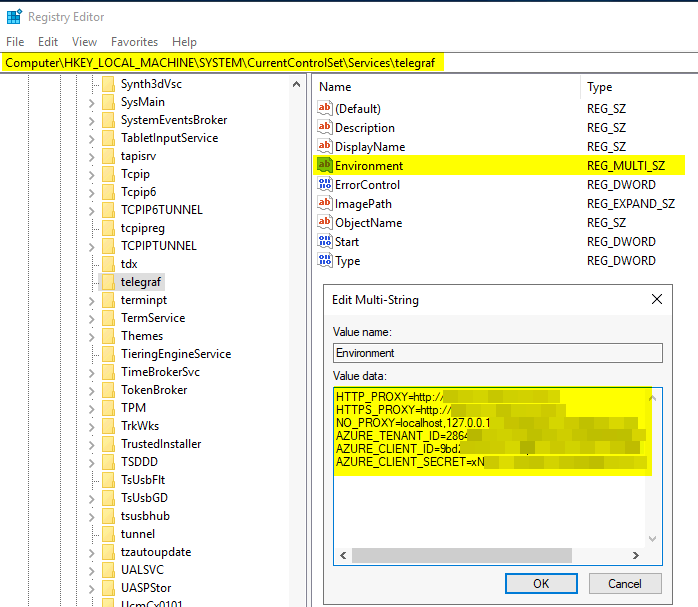
For the output side, I configured data to be stored in the local InfluxDB as well as ADX. Telegraf was installed as a Windows service running with a domain account. For ADX, I needed to add the required environment variables in the Windows Registry.
Setting up InfluxDB
Setting up InfluxDB Core is straight forward following the documentation provided. I opted to use the file system to store data and creating a plugin directory to take advantage of the Python processing engine, which we will cover in part two of this series.
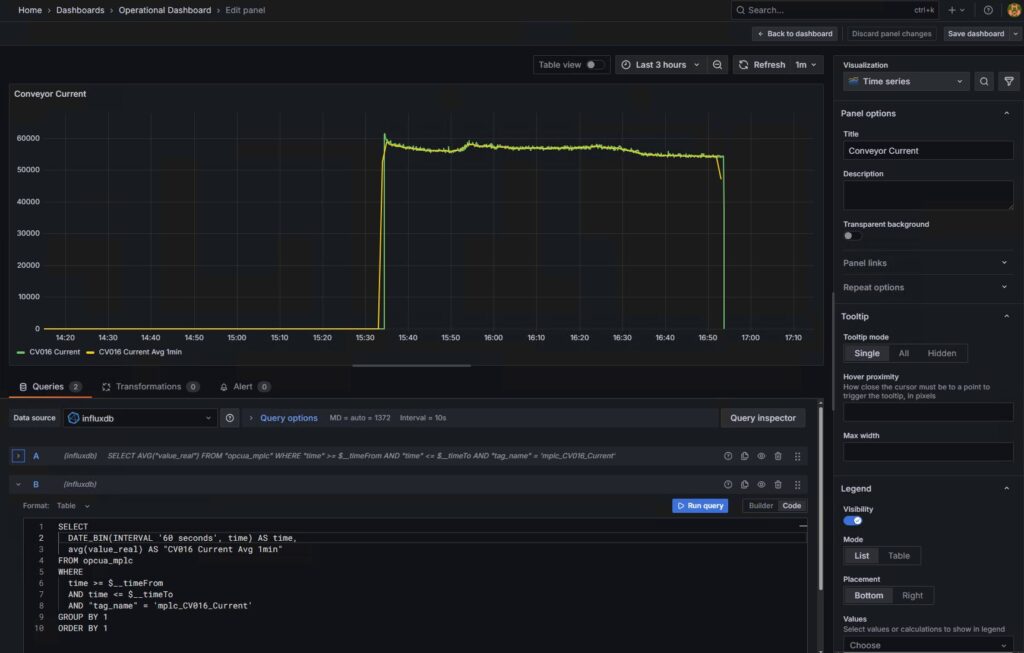
I created a basic trend in Grafana, one with the real-time data as it comes in as well as a 1-minute average trend, using the new SQL aggregation queries. The Core version only stores data for three days and should be good for most on-prem needs.
Setting up ADX
The ADX cluster is already running for the enterprise solution and I am not going to cover the deployment and setup of the resource itself, but you can view a previous post on ingesting data into ADX. I created a table in ADX for Telegraf to write the data to and setup a materialized view that will aggregate data for different time interval as required for longer term reporting.
Data stack comparison
Advantages
Reduced latency and complexity. Removing components from the pipeline means data flow has less friction and gets to where it is needed quicker. Less software in between, less patching and updating. It makes troubleshooting issues much simpler. Expanding the system also involves less steps.
Reduced costs. While initial cost of existing historian licence may be a sunk cost, the annual fee can be saving as well as additional licensing cost for expanding the system. There is also a huge time saving cost as there is less components to monitor and troubleshoot. Less time spent with paid technical support to solve an issue with their complex software. No need to train employees on how to use the historian software and they can use more familiar tools like Grafana and PowerBI.
Increases uptime of the solution as there are less moving parts that can break. Telegraf is a single point of failure for data collection, unlike the traditional historian that relies on several services. Even documentation is much simpler, available on the internet and you chat with AI.
Disadvantages
Manual config of the Telegraf config files, but there would be some manual configuration needed for the traditional historian as well. Support may be an issue with open-source, unless to opt for the paid versions.
Typically, the open-source apps get more frequent updates which will require a little more time but can be part of monthly patching activities. The other disadvantage can be the introduction of breaking changes in updated versions.
Conclusion
I demonstrated how we can use modern open-source applications, to simplify and streamline a traditional data stack, while reducing cost and latency. While there is room for improvement in the modern stack, the minor disadvantages are outweighed by the other benefits.
While this part focused on replacing the data storage and retrieval, which is a great improvement, the modern data stack needs to offer more. In part 2, we will focus on leveraging our new data stack to incorporate real-time analytics, leading to faster insights and actions.


