Blazingly fast dashboards with InfluxDB
Enabling real-time data analysis implies that data can be processed and analysed immediately after collection and enables immediate insights and actions. While not all systems need real-time data, there is a need for fast data retrieval and reducing the wasted seconds for data to load and process data, even if just for a dashboard.
In my previous post, on building a home energy monitoring dashboard, we covered the basics to collect data and display it in a Grafana dashboard. In this post, we will improve our data collection process and upgrade our database to make our data load instantly, with aggregations.
Implement InfluxDB Core
One of the considerations previously, was using InfluxDB as our time-series database, which was version 2 at that time. With the recent release of InfluxDB 3, I thought it would be a good opportunity to test it out as it has been rebuild using Rust and the FDAP stack – which means it should be blazingly fast. Additionally, it now supports SQL queries which removes another barrier to make it more standard.
The Core version only stores data for 72 hours (which can be in memory or file based), which makes it ideal for edge use cases and short-term operational reporting and real-time dashboards. The Enterprise version offers unlimited history and a bunch of other features, which is free for home / personal use.
Setting up InfluxDB Core
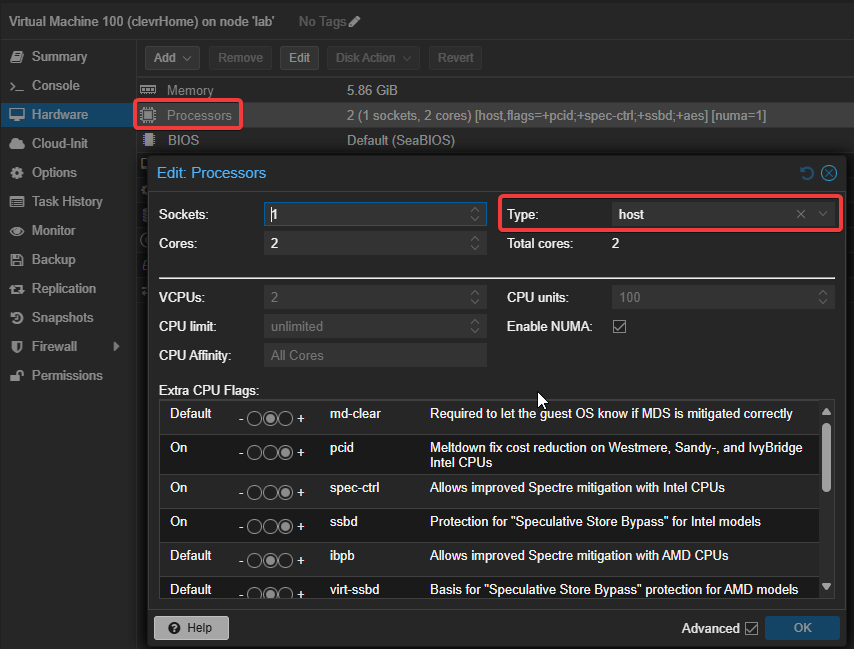
I had quite a challenge to get the docker container running on my Proxmox virtual server. When the container was initialised, it kept on restarting with no logs and just an exit code of 132. After a few hours of Googling I found out that it is related to the CPU instruction set incompatibility which should not be an issue as I am running an Intel i5, 7th Gen.
Not finding joy, I turned to ChatGPT, gave it some context and it quickly gave me a few common causes. One of the issues related to how the CPU features of the emulated virtual server is configured. A simple change from the default processor setting Default (kvm64) to host solved the problem and the container was up and running.
Improve data collection
In the previous post, we created a simple Python function that reads data from devices and inserts it into the database. While this approach works, it is not efficient as it inserts data one row at a time. In the updated version, I batched all the collected data together and do a bulk insert.
The code below shows the simple change for the WriteSQLToDB function.
For InfluxDB, using the Python SDK, I created a similar function that bulks inserts the data.
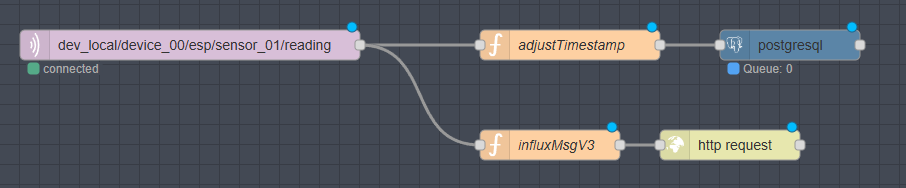
I also have an ambient temperature sensor, that send data via MQTT and with NodeRed, I wrote the data to TimeScaleDB. To get this data into InfluxDB, I opted to use the new REST endpoint to insert the measurements into the database.
Update and test the dashboard
I started off by duplicating the existing Grafana dashboard and then worked through changing the datasources and adapting the SQL queries. The migration process was quite quick as there were only minor differences in the SQL syntax. Below is an example showing the TimeScaleDB query versus the InfluxDB query.
Now time to the fun part to show the results. I created a side-by-side comparison using the 24-hour trends. There is a clear winner with the data from InfluxDB loading practically instantly. Loading time is now down from 6 seconds to almost zero. On refreshes, the loading indicator causes no more anxiety as there is no lag when loading the data.
Conclusion
There is quite a dramatic increase in dashboard loading time using InfluxDB Core, that I was able to get working “out-of-the-box” quickly. While I can probably get TimeScaleDB to be more performant, creating materialised views and indexes, this is extra effort. The SQL language support also sped up migration process the existing queries in Grafana.
I have integrated InfluxDB Core into my stack as the real-time engine that drives my dashboard and in future unlocks real-time analytics and actions. Another feature, is the ability use Python plugins which opens up many possibilities. For now, I still use TimeScaleDB as my long-term storage and will test out the free Enterprise version of InfluxDB.


